Article
Uncover the hidden benefits of rental-with-equity programs and learn how to turn your lab’s dreams into reality.
In the following application note, we explore the analysis of residual solvents using the Agilent Intuvo 9000 GC and the Agilent 8697 Headspace Sampler.
Introduction
Analysis of residual solvents is a critical application in the pharmaceutical industry. These volatile organic compounds are typically essential to the production of pharmaceuticals. However, they are unwanted in the final products. USP <467> defines the acceptable limits of these residual solvents, classifies them into three categories, and provides procedures for their analysis. The methods outlined in USP <467>, procedures A and B, each employ a unique column phase. Between the two procedures, all class 1 and class 2 solvents can be separated, and a concentration limit test can be applied. According to the USP <467> Interim Revision Announcement for 2019 and 2020, methylisobutylketone (MIBK) was added to the class 2A solvent list. MIBK is also now used for the resolution requirement of procedure B.1 Likewise, two additional solvents were recommended to be added to the USP <467> class 2 list according to ICH Q3C(R8).2 The two new solvents, cyclopentyl methyl ether (CPME) and tert-butyl alcohol (TBA), are not yet made official in USP <467>.
Residuals solvent standards were obtained from Agilent for the class 1 (part number 5190-0490), class 2A (part number 5190-0492), and class 2B (part number 5190-0513) solvents. Each mix was prepared at its limit concentration in 500 mL of ultrapure water in 1 L bottles. MIBK, TBA, and CPME were spiked into the class 2A solution at their respective limit concentrations. Cumene was also spiked into the class 2B solution at its limit concentration, as it was absent from the class 2B solvent mix. Six milliliters of each solution was dispensed into 20 mL headspace vials using a Brand Dispensette. The vials were then immediately capped with PTFE-lined septa crimp caps.
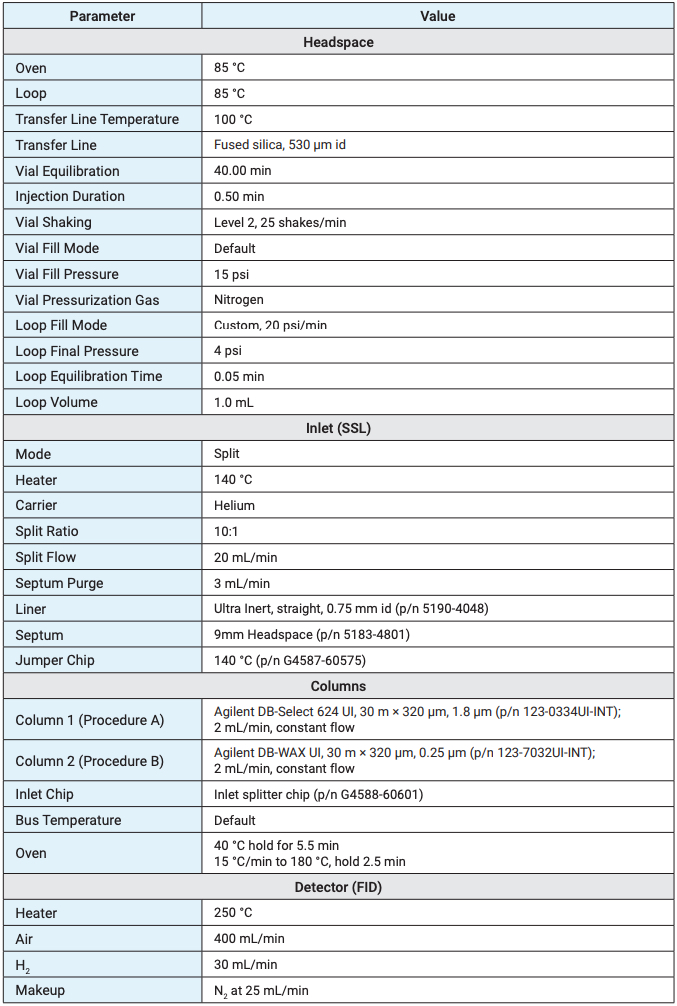
USP <467> describes two procedures, A and B, using different column phases to separate the class 1 and 2 solvents. Procedure A uses a G43 phase (Agilent DB-Select 624 UI), while procedure B uses a G16 phase (Agilent DB-WAX UI). Both procedures are combined into a single, dual-column, dual-FID analysis. The Agilent 8697 headspace sampler (HSS) transfer line was connected directly through the inlet septum of the Agilent Intuvo 9000 GC. An inlet splitter chip allows the flow from the inlet to equally split between two different columns. These two columns are then connected to two FIDs, one mounted on top of the Intuvo 9000 and the other on the side in the D2 accessory. Method parameters were based on guidance from USP <467> as well as previously published work on the Agilent 7697A HSS (Table 1).3,4 The 8697 HSS provides all the same method parameters that are found on the Agilent 7697A HSS, greatly simplifying method transfer between the two instruments. Not only are the method parameters identical between the 8697 HSS and 7697A HSS, but they share the same sample flow path and overall sampling and injection functions. The only headspace parameter that was adjusted from the previous work on the 7697A HSS was the final loop pressure. Previous work has used a final loop pressure of 0 psi, as opposed to the default loop fill behavior, which ultimately results in less sample injected onto the GC. While a final loop pressure of 0 psi provides improved resolution, it comes at the cost of injection precision, since the loop pressure is running in passive backpressure control mode. Setting the final loop pressure to 4 psi has a negligible effect on resolution while still providing active sample loop backpressure control to improve injection precision.5 The GC method conditions remained almost identical to previously published work. A higher split flow of 10:1 and a longer, 5.5 minute initial oven hold time, were the only changes.
Table 1. Instrument conditions for the Agilent 8697 headspace sampler and Agilent Intuvo 9000 GC.
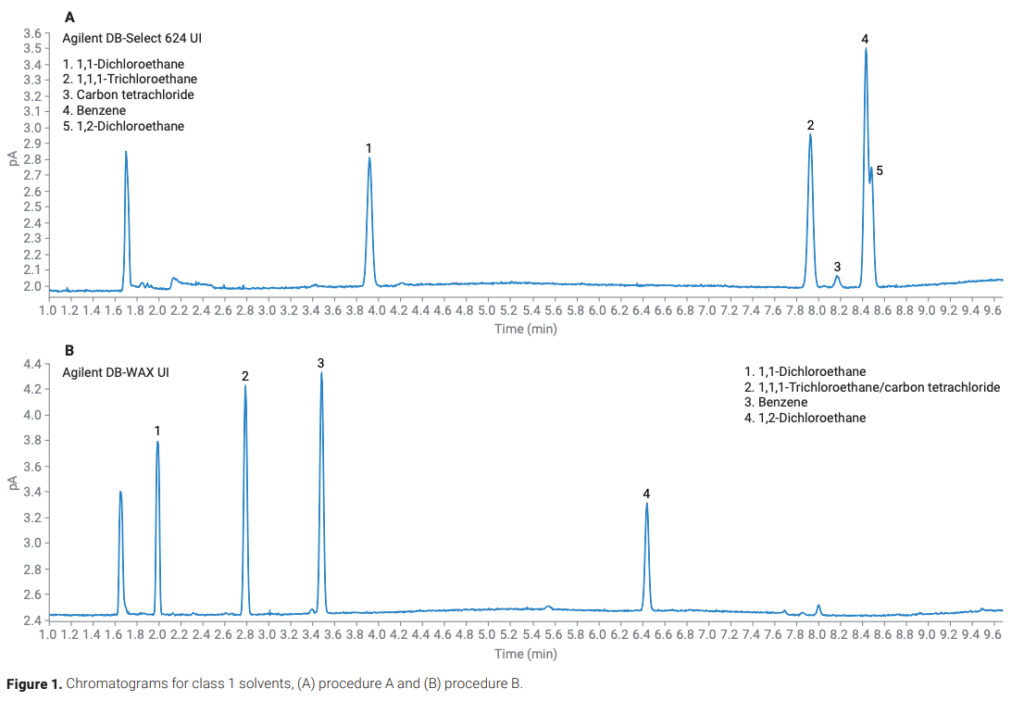
The class 1 solvents have the lowest acceptable limits of the USP <467> solvents. Therefore, it is essential to ensure that the system meets the signal‑to-noise ratio (S/N) requirements of the method. USP <467> requires that the S/N of all class 1 solvents be no less than 3 across both procedures. The method specifically requires S/N of no less than 5 for 1,1,1-trichloroethane on procedure A and no less than 5 for benzene on procedure B. The S/N requirements for the class 1 solvents were met and exceeded, with excellent peak area and retention time precision (Table 2, Figure 1).
Table 2. Retention time and peak area precision (n = 10). Values marked N/A were coelutions.
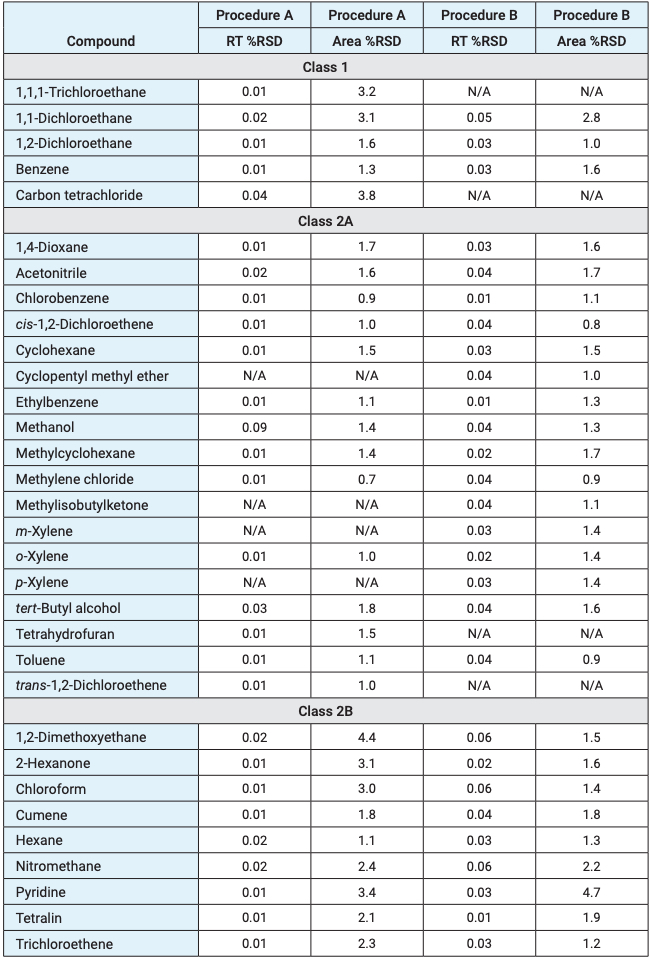
Figure 1. Chromatograms for class 1 solvents, (A) procedure A and (B) procedure B.
The class 2A solvents encompass the largest set of solvents found in USP <467>. As such, resolution is a primary concern. USP <467> contains specific resolution requirements for each procedure. Procedure A requires a resolution of no less than 1.0 between acetonitrile and methylene chloride, while procedure B requires a resolution of no less than 1.0 between methylisobutylketone and cis-dichloroethene. Both requirements were met and exceeded. Any coelutions that had occurred in procedure A were resolved in procedure B, including the three solvents that were added to this class (Figure 2). The peak area and retention time precision of all class 2A solvents was excellent, with all peak area RSDs below 2% for both procedures (Table 2). The increased split ratio and longer initial oven hold time helped to achieve overall better chromatographic resolution. Particularly between MIBK and acetonitrile on the DB-WAX UI column, their resolution was improved while still meeting the S/N requirement for the class 1 solvents (Figure 3). However, if increased sensitivity is needed, a lower split flow of 5:1 still met the resolution requirements for the other class 2A solvents.
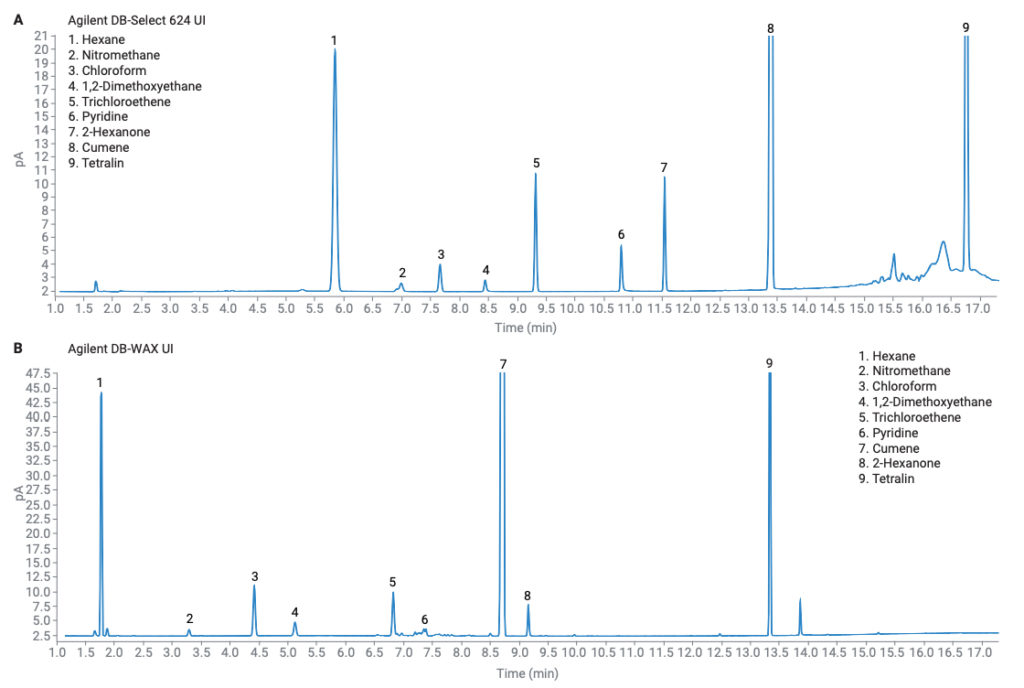
The class 2B solvents do not have any performance requirements. There were no coelutions on either column, and again, excellent results were achieved for both peak area and retention time precision (Table 2, Figure 4).
Figure 2. Chromatograms for class 2A solvents, (A) procedure A and (B) procedure B.
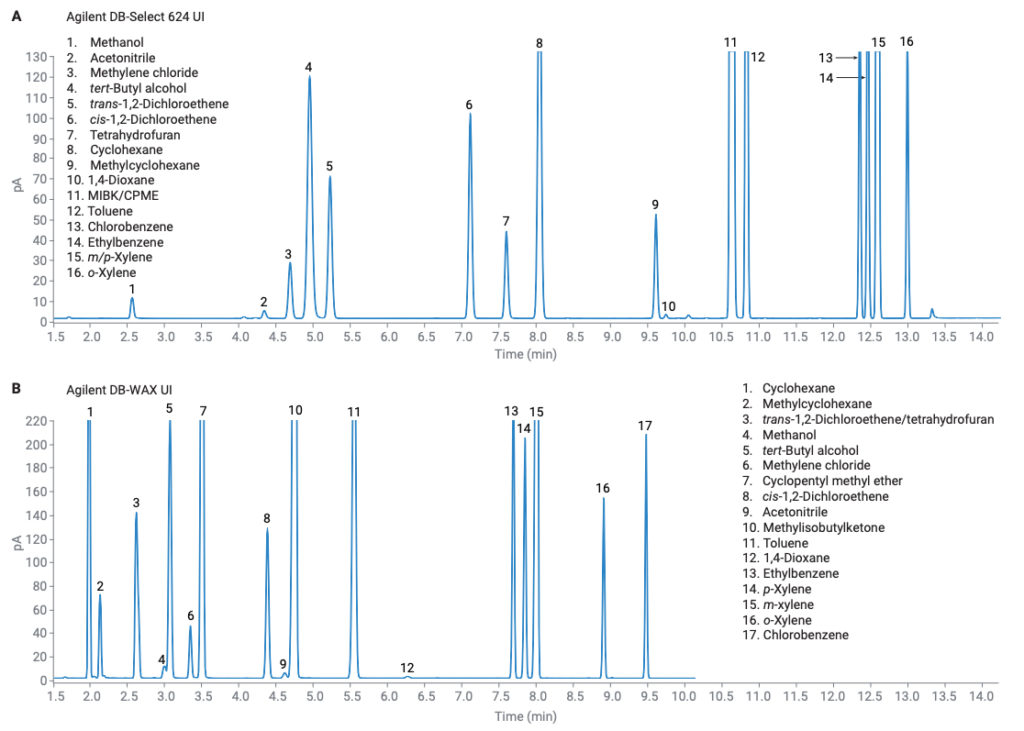
Figure 3. USP resolution between acetonitrile and MIBK on an Agilent DB-WAX UI column. 5:1 versus 10:1 split ratio.
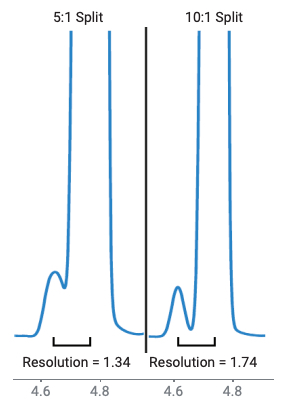
Figure 4. Chromatograms for class 2B solvents, (A) procedure A and (B) procedure B.
The Agilent 8697 headspace sampler demonstrated excellent performance for the analysis of residual solvents according to USP <467>. The results also show that method conditions from the 7697 HSS can be used on the 8697 HSS with comparable performance.
Learn more about the Agilent 8697 headspace sampler and request pricing information.
Put our expertise, strategic partnerships, and technical support capabilities to work for you.
8301 New Trails Drive, Suite 100, The Woodlands, Texas 77381
© 2024 Quantum Analytics | A Black Forest Ventures Company | All Rights Reserved | Privacy Policy
Complete this form below to sign up and we will reach out to you with instructions
